

Computer Analytics gives you visibility into how Perplexity Computer is being used — credit consumption, top users, most-used tools, and more. There are two views available, depending on your role:
Organization admins: organization-wide analytics across all members.
Organization members and consumer users: personal analytics for your own usage.
For organization admins
Admins can find Computer Analytics for their entire organization in Organization settings > Analytics > Computer.
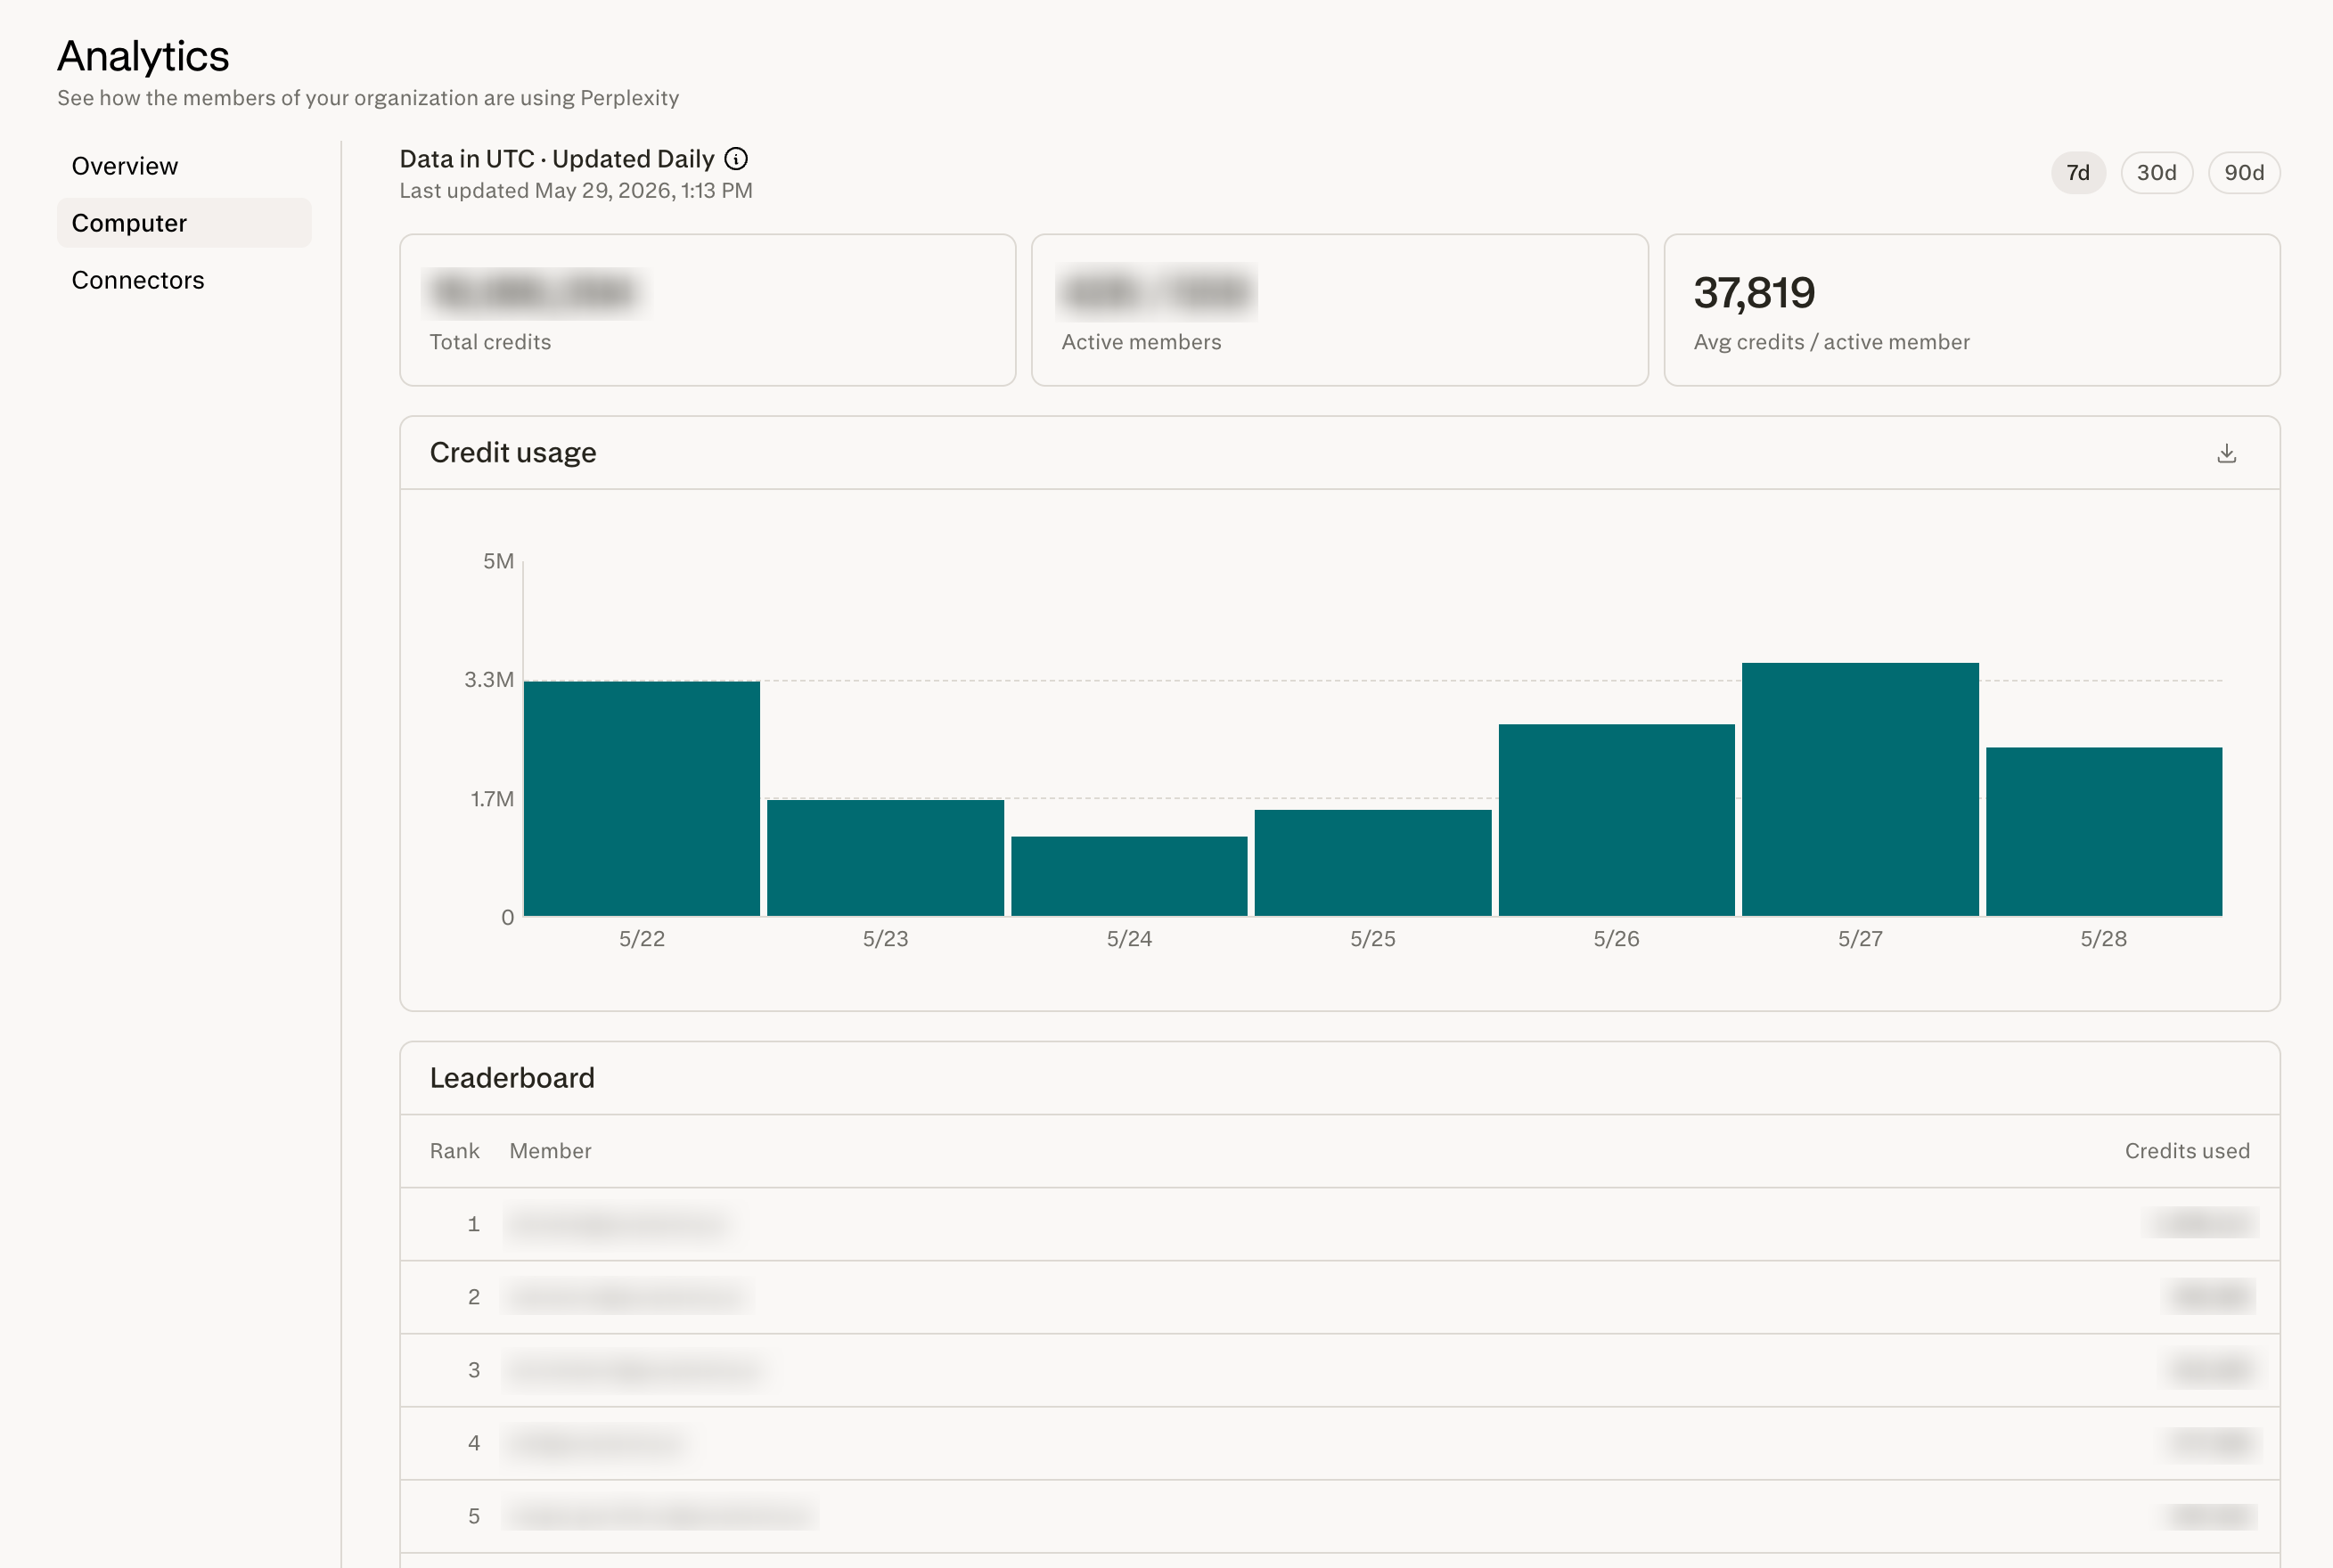
The admin Computer Analytics page gives you a complete view of how Computer is being adopted and used across your organization.
What you can do
Break down credit usage by day — track daily credit consumption across your org to spot trends, monitor spend, and identify usage spikes.
Group credit usage by model or credit source — use the Group by control on the Credit usage chart to see which models are driving your org’s spend (for example, Claude Opus 4.8, Claude Fable 5, GPT-5.5) or split usage by credit source. Choose None to view total credits without a breakdown.
View the top Computer users in your org — a usage leaderboard surfaces your most active members, helping you identify power users and champions.
Learn how Computer is being used in your org, including:
Artifacts generated (documents, spreadsheets, presentations, and other outputs created by Computer)
Top connectors (which integrations your members rely on most)
Top skills (which Computer skills are driving the most value)
Top projects (where Computer activity is concentrated)
Average task duration across your org
Export data for custom analysis — download usage data to run your own reporting, build dashboards, or share with stakeholders.
Who can access it
Only organization admins can view this page. If you don’t see the analytics section, reach out to an existing admin in your organization to confirm your role.
Computer Analytics API
Enterprise organizations can also access Computer usage analytics programmatically via the Computer Analytics API. The API returns the same metrics shown in the admin dashboard — credits, connectors, artifacts, skills, projects, workflows, and task durations — as bucketed time series that can be pulled into BI tools or internal reporting. Analytics requests are free and don’t consume API credits.
Org admins can enable the API and generate a key from Organization settings > Computer > Analytics. The key is organization-scoped, analytics-only, and managed by any org admin. For setup steps, endpoints, parameters, and response details, see the full Computer Analytics API documentation.
For organization members and Perplexity Pro and Max users
Individual members can also see their personal analytics in All settings > Analytics. This is also available to Perplexity Pro and Max users (not on an Enterprise organization).
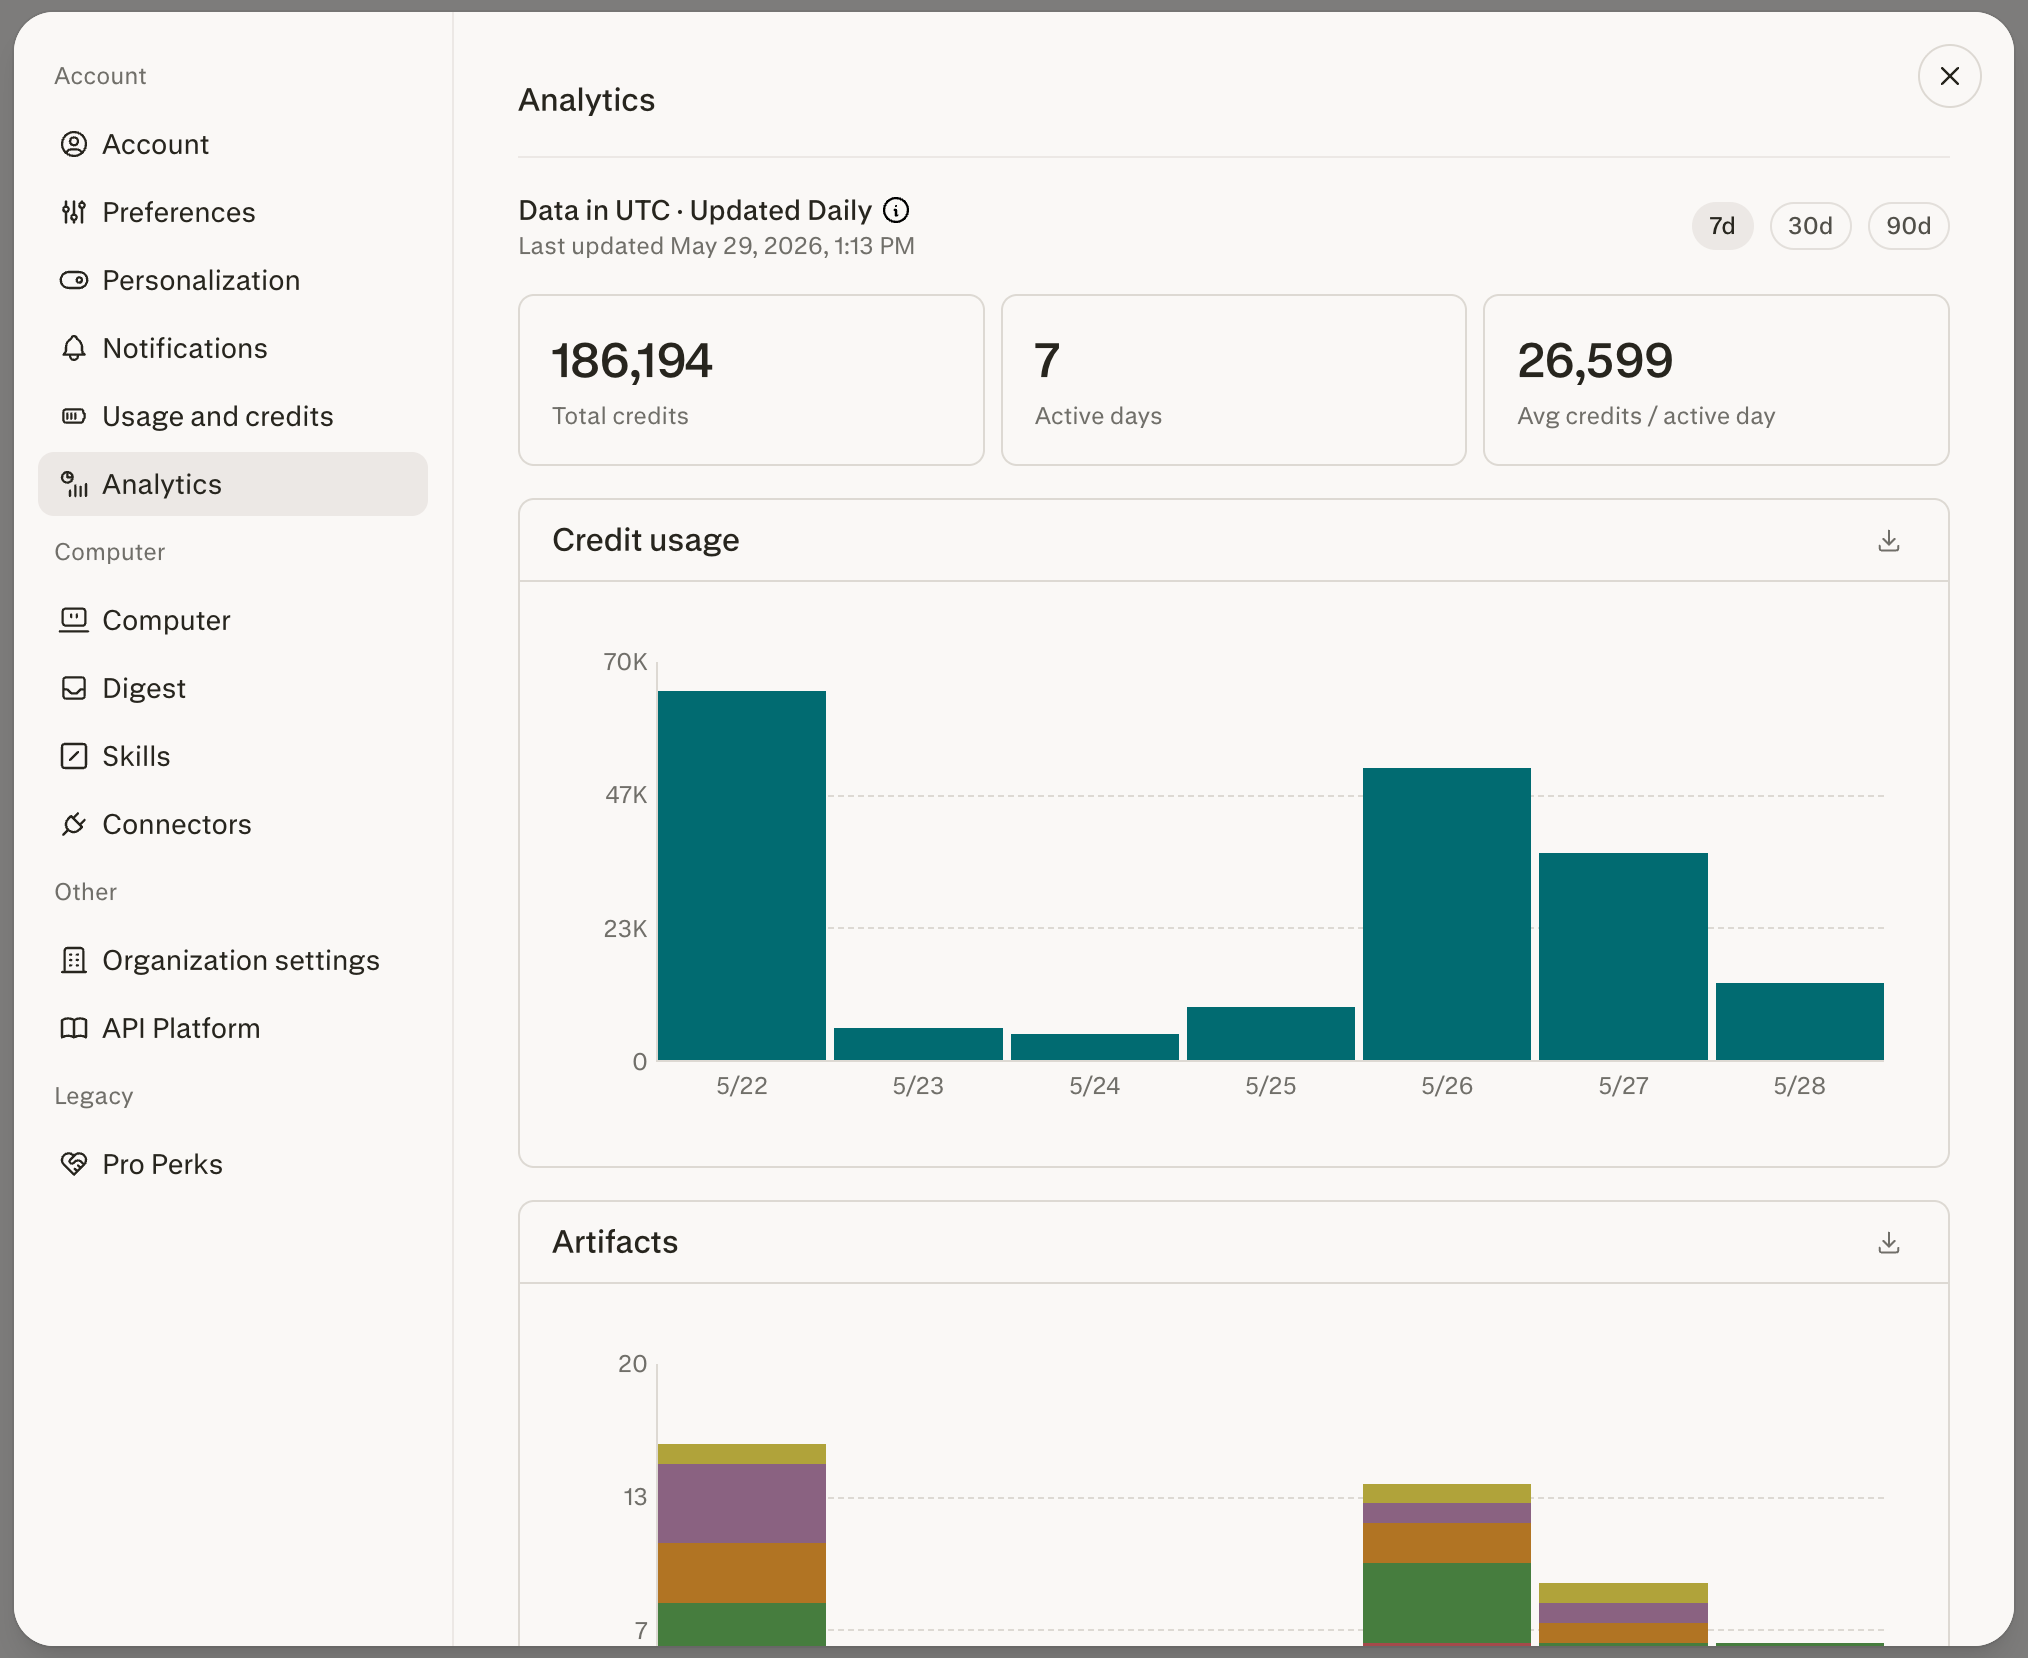
The personal Computer Analytics page helps you understand your own Computer usage — useful for managing your credit budget and reviewing how Computer fits into your workflow.
What you can do
Break down your own credit usage by day — see exactly how your credits have been spent over time.
Group your credit usage by model or credit source — use the Group by control on the Credit usage chart to see which models account for your credit spend, or split it by credit source. Choose None to view total credits without a breakdown.
Explore how you’re using Computer, including:
Artifacts generated by your tasks
Top connectors you’ve used
Top skills you’ve invoked
Top projects where you run Computer
Average task duration for your tasks
Who can access it
Individuals using Perplexity Pro and Max, and organization members, can view their personal analytics page.
FAQ
How do I break down credit usage by model?
First, open the Credit usage chart. Org admins can find it in Organization settings > Analytics > Computer. Individual members and Perplexity Pro and Max users can find it in All settings > Analytics.
On the Credit usage chart, open the Group by control in the top-right corner and select Model. The chart then shows a stacked breakdown of credits by model for each day, with a colour-coded legend below the chart. You can also group by Credit Source, or select None to see total credit usage without a breakdown. This is available in both the org-wide admin view and the personal analytics view.
Can org members see other members’ usage?
No. The personal analytics page only shows your own activity. Org-wide visibility, including the leaderboard, is restricted to admins.
How often is the data refreshed?
Data is refreshed once per day, so the most recent complete data is typically from the previous day.
Where can I learn more about credits?
See the How Credits Work for Enterprise organizations — Member Guide article (or How Credits Work on Perplexity for Perplexity Pro and Max users not on Enterprise organizations) for details on how credits are calculated and what counts toward your usage.